Machine learning for mood prediction of high school students
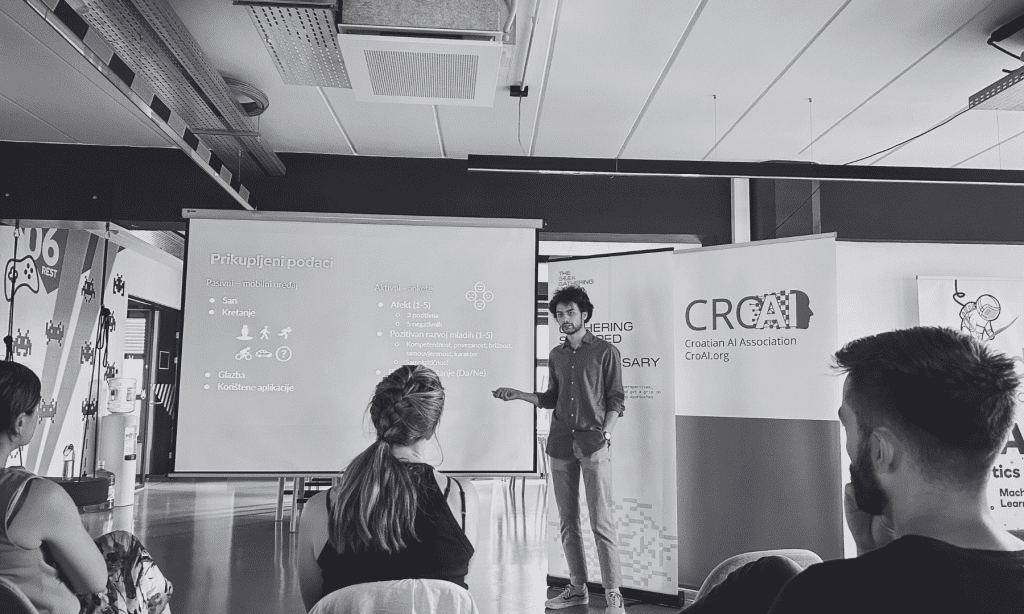
With recent developments in the field of machine learning, collecting and analyzing data has become a crucial part of improving almost every industry in the world. This is why researchers from the Faculty of Education and Rehabilitation Sciences in Zagreb approached us to determine to which degree state-of-the-art machine learning methods can predict the mood of high school students. A successful model could be used for the early detection of mental disorders like depression in high school students. Understanding the data At the heart of every machine learning project is data. This makes understanding the dataset the most crucial part of a machine-learning project. To understand our dataset we must first understand how it was collected, what types of data were collected, and which variables will be used as features/predictions. Data collection Data about Croatian high school students was collected (with their knowledge and consent) by the Zagreb Faculty of Education and Rehabilitation Sciences over the course of eight days. It included data about their physical activity, music taste, application usage, amount of sleep, mood (affect), and behavior. Our task was to predict their mood using all other available data sources. Passive and active data Before even looking at our dataset it is important to understand how the data was obtained. Data regarding physical activity, music taste, application usage, and amount of sleep were gathered directly from subjects’ phones without the need for them to enter any information into the phones. On the other hand data about their mood and behavior was collected by providing the subjects with questionnaires. The first group of data is called passively collected data and the second is called actively collected data. Both methods have advantages and disadvantages. The advantage of passively collected data is that it does not rely on humans’ subjective view of the situation. For example, if you were interested in someone’s sleep duration you would probably get more accurate data using a stopwatch than asking them how long they slept that day. The biggest disadvantage of passively collected data is that subjective things like emotions or taste can’t be measured. Also, as we will see later on, the quality of the passively collected data mostly depends on the algorithm used for collection. If the algorithm is flawed we won’t be able to extract useful information from the data. Unlike passively collected data, actively collected data can be used to gain information about almost all topics, however, its main disadvantage is that it almost always provides data of lesser quality. Different people can have different reactions to the same situations and people can, intentionally or unintentionally, provide wrong or conflicting answers to some questions. Since the variable we are trying to predict is actively collected, we will need to take into account the said disadvantages when accessing our model’s performance. Exploring the dataset After we understood the data collection process we can finally dig deep into our dataset. The first thing we have to do is visualize our variables. Sleep duration data One of the things that sticks out in our data is that we have two data sources for sleep duration – an accelerometer and a phone manufacturer’s internal algorithm. To decide which one to use we will visualize both using a box-plot. Image 1: Sleep duration box-plots The box part of the plot represents the interquartile range (IQR) of the data or simply it shows us where the middle 50% of the data points are located with the line inside the box representing the median. The whiskers extend from the box and represent the range of the data beyond the IQR. The length of the whiskers is typically 1.5 times the IQR. Data points outside that range are considered outliers and are marked with dots. Now that we know how to read the box-plot we can combine it with some general knowledge to select the data source we want to use. A major advantage of the accelerometer is that the median sleep of around 8 hours is much more realistic than the algorithm’s median of more than 9 hours. Also, extremely high values like 20 hours of sleep are labeled as outliers in the accelerometers box-plot while they are inside the expected distribution for phone algorithm data. For these reasons, we decided that accelerometer data is to be used. Physical activity data Another interesting data distribution is that of the physical activity data. We have plotted a histogram of how long the subjects were stationary. Image 2: Stationarity distribution We can see the histogram mostly looks normal however there is a large amount of values that represent less than 100 minutes of stationarity per day. Since high school students in Croatia have at least six classes per day and each class is 45 minutes long we can conclude that they should spend at least 270 minutes every day stationary. Any value less than that can be considered an outlier or an error in measurement. This is a problem because around 35% of our data regarding stationarity should be discarded. To try to minimize this problem we decided to replace all outliers with the median value of the rest of the dataset. Correlation between features and labels Last but not least it is important to visualize the correlation between our features and our labels. In the next image, we visualized the correlation between physical activity and positive/negative affect that we are trying to predict. Image 3: Correlation between physical activity and affect We can see that the correlations are quite low. We see this problem in all data sources. To increase the correlations we can try to combine certain variables. For example, instead of using time spent on Instagram, Facebook, and Youtube,… we can combine those variables into time spent on social media which may have a higher correlation. While machine learning models can model more complex relationships between variables than a simple correlation, a low correlation is suggesting that before mentioned problems with data, quality will affect our final